Yesterday: 7.0 L water, 287+287 ml A/B, 0 ml acid, 31 ml pH-up, EC 1302, pH 5.85, air 13.1–27.9°C. Today so far: ● all good, nothing needs your hands. A stock: 14645 ml since 09-11 ≈ 56.2 days left. B stock: 13427 ml since 09-07 ≈ 51.6 days left. acid stock: 997 ml since 09-02. pH-up stock: 2207 ml since 09-11 ≈ 90+ days left. Feed cost today: $0.00. Dairy Flat forecast: today 11.3–15.4°C, rain 0.2mm.
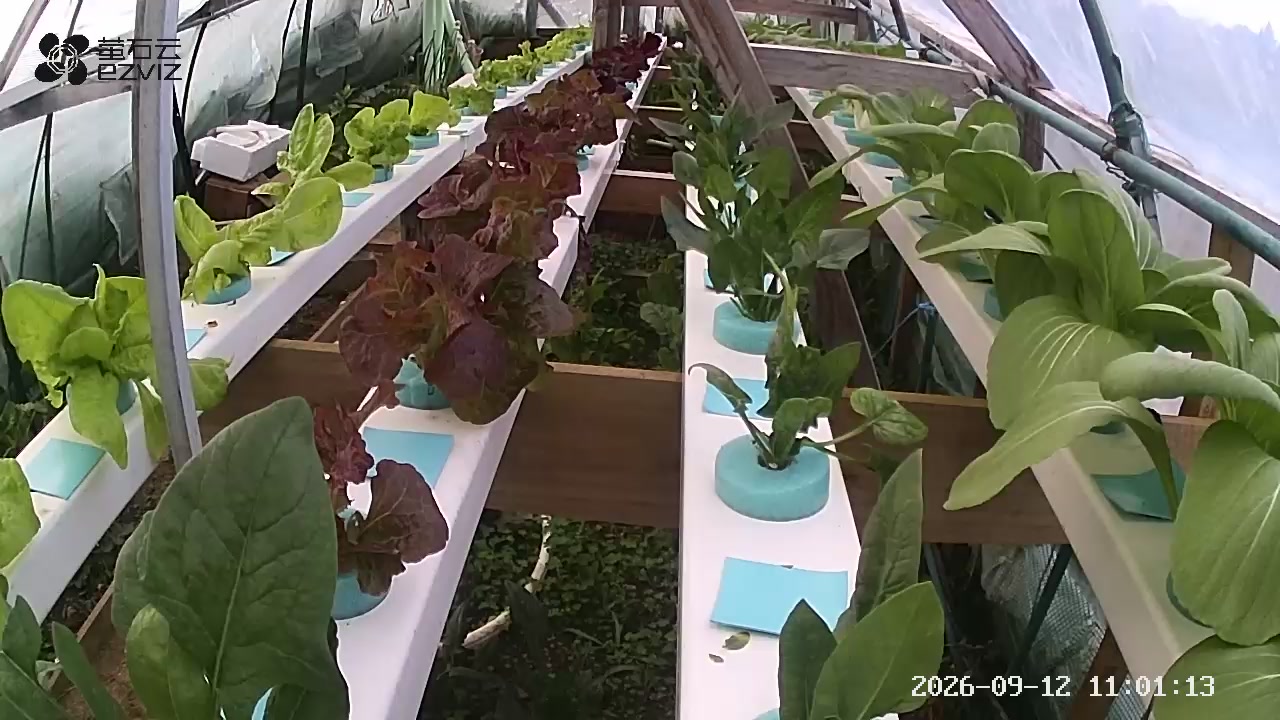
Canopy cover 30.2% of the frame, +4.9 pts vs yesterday, +20.4 pts vs a week ago — the canopy is filling in.
Canopy cover = share of the picture that is leaf-green, from the frame nearest noon each day. Fixed camera, so the trend is comparable; the absolute value is not a measurement.
| date | water L | A ml | B ml | acid ml | pH-up ml | rounds | feed/L | EC µS/cm | pH | water °C | air °C | vent h | GDD | comfort h | canopy % |
|---|---|---|---|---|---|---|---|---|---|---|---|---|---|---|---|
| ● 2026-09-13 | — | 17 | 17 | — | 2 | 1 | — | 1301 (1296–1306) | 5.86 (-0.01/d) | 16.1–17.0 | 13.3–15.4 | 0.0 | 9.4 | 0.3 | — |
| ● 2026-09-12 | 7.0 | 287 | 287 | — | 31 | 13 | 82 | 1302 (1274–1313) | 5.85 (+0.04/d) | 15.5–21.2 | 13.1–27.9 | 4.8 | 15.5 | 16.0 | 30.2 |
| ● 2026-09-11 | 3.2 | 269 | 269 | — | 14 | 8 | 168 | 1297 (1270–1311) | 5.77 (+0.07/d) | 16.0–21.6 | 14.0–27.6 | 6.8 | 15.8 | 17.8 | 25.3 |
| ● 2026-09-10 | 7.1 | 300 | 300 | — | — | 6 | 85 | 1293 (1268–1304) | 5.87 (-0.21/d) | 14.0–22.4 | 11.6–32.0 | 8.6 | 16.8 | 11.9 | 21.0 |
| ● 2026-09-09 | 3.6 | 200 | 200 | — | — | 4 | 111 | 1296 (1281–1316) | 5.84 (+0.33/d) | 14.2–26.0 | 11.2–33.5 | 9.8 | 17.4 | 4.4 | 16.8 |
| ● 2026-09-08 | 7.6 | 350 | 350 | — | — | 7 | 92 | 1293 (1262–1304) | 5.7 (-0.12/d) | 15.9–23.0 | 12.1–30.3 | 9.0 | 16.2 | 12.8 | 15.1 |
| ● 2026-09-07 | 7.0 | 400 | 400 | — | — | 8 | 114 | 1291 (1265–1303) | 5.77 (-0.03/d) | 18.7–24.3 | 16.1–32.7 | 5.3 | 19.4 | 20.6 | 16.5 |
| ● 2026-09-06 | 7.0 | 400 | 400 | — | — | 8 | 114 | 1291 (1260–1301) | 5.85 (-0.10/d) | 14.4–25.1 | 11.2–35.4 | 8.9 | 18.3 | 10.3 | 12.8 |
| ● 2026-09-05 | 6.6 | 450 | 450 | — | — | 9 | 136 | 1285 (1253–1301) | 5.92 (-0.04/d) | 15.4–23.0 | 12.1–30.5 | 8.4 | 16.3 | 7.8 | 9.8 |
| ● 2026-09-04 | — | 350 | 350 | — | — | 7 | — | 1283 (1192–1401) | 5.88 (+0.07/d) | 17.4–26.6 | 13.6–28.3 | 3.5 | 15.9 | 17.5 | 11.9 |
| ● 2026-09-03 | — | 400 | 400 | — | — | 8 | — | 1280 (1247–1295) | 5.84 (-0.01/d) | 16.2–26.5 | 13.0–34.3 | 8.6 | 18.6 | 7.9 | 9.2 |
| ● 2026-09-02 | — | 350 | 350 | — | — | 7 | — | 1272 (1211–1295) | 5.9 (-0.05/d) | 14.1–22.7 | 11.0–30.8 | 7.7 | 15.9 | 11.6 | 7.5 |
| ● 2026-09-01 | — | 400 | 400 | 3 | — | 8 | — | 1252 (1128–1388) | 6.02 (-0.04/d) | 11.9–21.7 | 12.2–26.9 | 1.3 | 14.5 | 13.8 | — |
| ● 2026-08-31 | — | — | — | — | — | — | — | 1261 (1186–1321) | 5.96 (-0.04/d) | —–— | 11.9–27.4 | 2.1 | 14.6 | 11.3 | — |
How to read this: daily water is what the float valve replaced — mostly transpiration, so it tracks plant mass and sunshine: a rising trend is the most honest "plants are growing" signal there is. Daily A/B feed is what the controller added to hold EC at target — nutrient actually consumed. feed/L is A+B per litre of water replaced, the strength the plants effectively drank at: steady means normal growth, a drop on a hot day is transpiration outrunning uptake, a drop on a cool day says look at the roots. This is a recirculating NFT, so uptake is not measured as inlet minus outlet: one pass through the channel moves EC by less than a probe can resolve, and the water and salts a plant removes are put back by the float valve and the doser. Counting what had to be put back is the honest measurement. pH /d is the day's drift: living roots push pH around, the direction tells you which nitrogen form they are eating. EC and temperature ranges show how steady the environment was held. Water before 2026-09-02 may show from meter events only or not at all (the meter column was added that day).